This is the first of a three-part series on data and analytics integration hubs.
Most organizations are riddled with data silos and saddled with a dizzying array of analytical tools. As a data analytics manager, your natural inclination is to consolidate: that is, consolidate data silos into an enterprise repository where data can be easily modeled, integrated, and governed; and standardize on a single business intelligence (BI) tool to streamline support and training and reduce costs.
If your only strategy is to consolidate, you’ll suffer the same fate as the Greek king Sisyphus who was doomed by Zeus to perpetually push a boulder up a hill. To get the data analytics gods on your side, you need a more nuanced approach that accommodates political reality. Most organizations are not disciplined enough or centralized enough to succeed with consolidation strategies. Data and tools proliferate as quickly as you can consolidate them.
So, while it’s important to have a data warehouse and BI tool standards, it’s also important to be able to connect to data sources and BI tools dynamically. This gives organizations the ability to adapt to continually changing data and analytics environments. Products that stitch together existing BI and data resources into a seamless whole are called data and analytics integration hubs.
Core Components
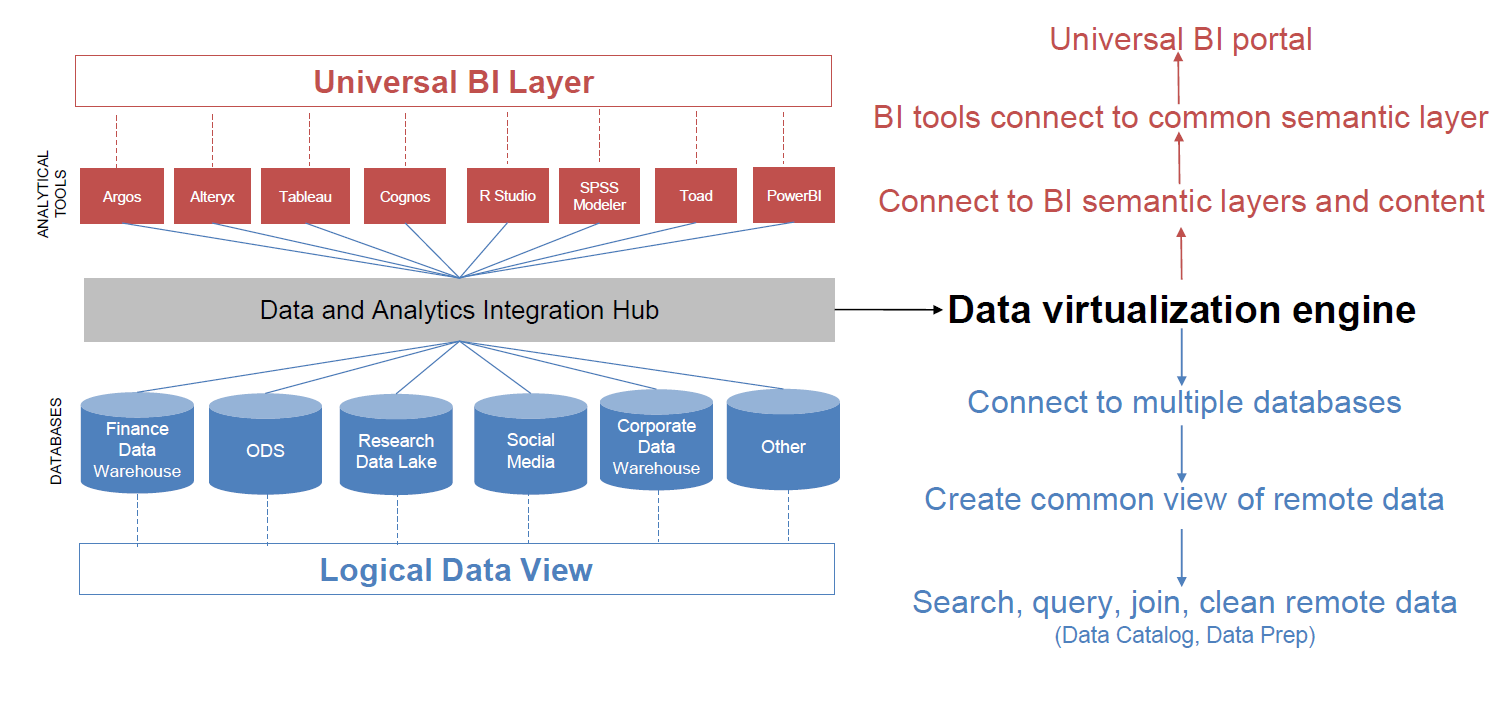
They give business users a single view of enterprise data assets as well as a single place they can go to access data, no matter where that data is located, what system it runs on, or what methods (i.e., BI tools) are required to access them. Data and analytics integration hubs are middleware that stitches together disparate data and analytics environments.
At the heart of a data and analytics integration hub is a data virtualization engine that gives business users real-time access to various resources without having to know where data is located, what system it runs on, or what methods (i.e., BI tools) are required to access them. The engines “virtualize” all back-end data sources, including BI models, making them seem as if they are part of single, integrated system that resides locally on their desktop or server. They use bidirectional connectors to federate queries and intelligent caches to optimize performance.
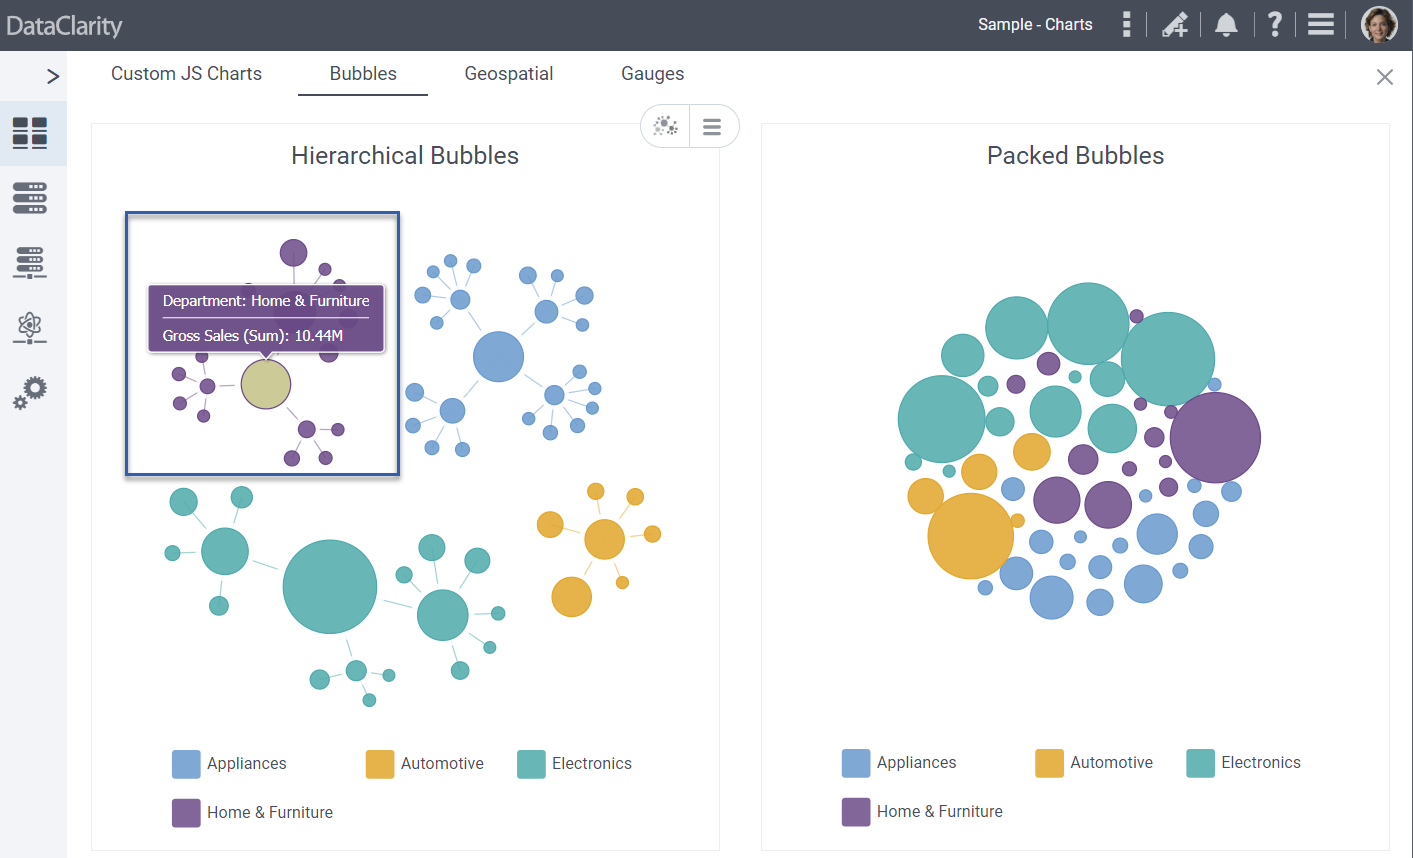
Data virtualization engines are not new. But few of them connect to BI tools, such as those from MicroStrategy, IBM (Cognos), SAP (BusinessObjects), and Tableau. Nor do many provide business user functionality to search, prepare, analyze, visualize and report on data. A data and analytics integration hub not only connects users to diverse data and BI sources, it also enables them to join, format, clean, and transform data as well as develop reports, dashboards, visualizations, and predictive models. (See figure 1.)
Figure 1. Data and Analytics Integration Hub
Thus, a data and analytics integration hub not only creates a data fabric that connects your BI tools and data silos, it’s also an all-in-one data and analytics workbench that facilitates self-service. It contains everything business users need to find, manipulate, analyze, and visualize data. It also makes life easier for architects and administrators to govern user access to data and analytical resources. Through granular security and single sign-on, administrators can provide a secure data analytics sandbox tailored to every business user.
Benefits and Challenges
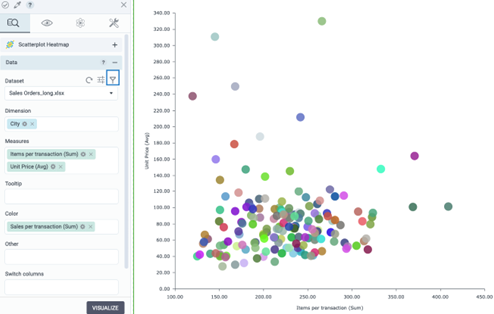
Benefits. A data and analytics integration hub offers several benefits. First, it integrates the data and analytics resources you have, avoiding the need to consolidate or replace them. This saves the time and cost required to migrate existing assets to a new platform, repoint applications, and inform users of the change. Second, it gives users one place to go to get any information they need. They can use the analytics tool with which they’re familiar to access logic and models built into another BI tool or data sets in remote systems. (See figure 2.)
Figure 2. Benefits of a Data and Analytics Integration Hub
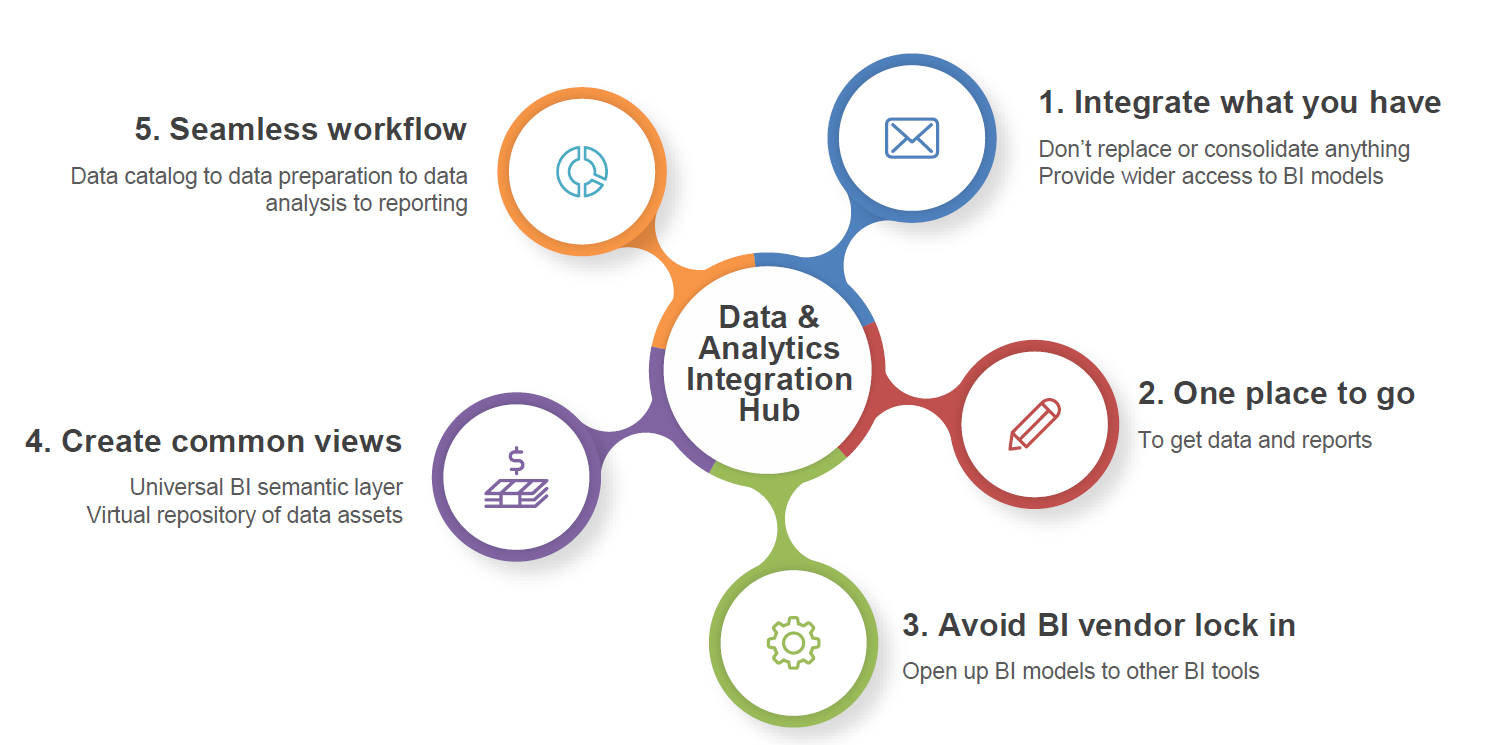
Third, it gives new life to incumbent BI tools that are used as glorified data extraction tools to download data from a data warehouse or other source into a desktop spreadsheet or database. Fourth, it provides a common or logical view of distributed data and BI resources, making them easier to find and query. It also provides a consolidated view of all reports no matter which tool created them in a single portal view, that can be tailored to each individual. And fifth, it supports the complete data analyst workflow required to facilitate self-service analytics.
Getting Started
When working with a data and analytics integration hub, most organizations start small. They use it to support a tactical use, such as the need to link two BI tools together. For instance, a company wants to give Tableau users access to data modeled in an incumbent reporting tool, such as IBM Cognos Analytics, without having to recreate that logic within Tableau.
Once organizations see the integration power of a data and analytics integration hub, they expand the footprint, adding other BI tools and data sources until they’ve created a data fabric that weaves together a majority of the company’s data and analytics assets. They might then discover its business user functionality—data catalog, data preparation, data visualization, data distribution—that makes it easier to implement self-service analytics. Given its broad platform and all-in-one capabilities, some companies decide to standardize on a data and analytics integration hub, reducing costs and duplication.
Part II in this series will focus on the data capabilities of a data and analytics integration hub.