The first article in this series introduced an emerging category of products, called data and analytics integration hubs, which stitch together disparate BI and data resources into a seamless whole. This article drills into the data implications of these hubs and how they help data analysts and data scientists find, explore, clean, and combine data distributed throughout an organization and beyond.
Data analysts and scientists are voracious consumers of data. They follow a highly iterative workflow to discover, prepare, and analyze data and share their insights with others. (See figure 1.) In most organizations, data analysts are left to their own devices to navigate this workflow. Without modern self-service tools and technology, they spend too much time finding and manipulating data rather than analyzing and interpreting it for others.
Figure 1. Data Analyst Workflow
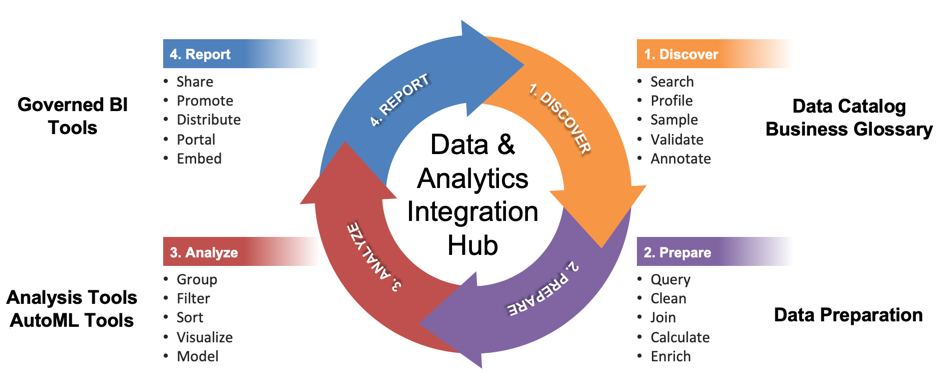
Discover. When given an assignment, the first thing a data analyst does is scour the organizations for relevant data assets to answer a business question. Some of those assets are centralized in a data warehouse or data lake, but many are not. For example, an analyst may want to clickstream data from a website, a social media platform, a marketing cloud application, or data from a human resources system. Hunting down relevant sources can take days or weeks. Then, for each source, the analyst may need to gain permission from the owner to access the data and might also be required to use a specific tool.
With data in hand, the real work begins—or not. First, the data analyst needs to examine the data to see if it meets her needs. How many records? How many columns? What is the range of values in those columns? How many nulls? How are the metrics calculated? Where did the data come from? Who has used this source before and for what purpose? Tribal knowledge goes a long way to helping data analysts discover relevant data sources.
Prepare. Once the analysts identify the proper data sets, then they must prepare them for analysis. This involves formatting, cleaning, and combining data sets to create a single table, either physical or virtual. From there, they apply logic to enrich the data set. They might create a new field by summing the values in two columns or create custom groups and benchmark their performance over time. They might also enrich the data set with local data (i.e., spreadsheets) or external data.
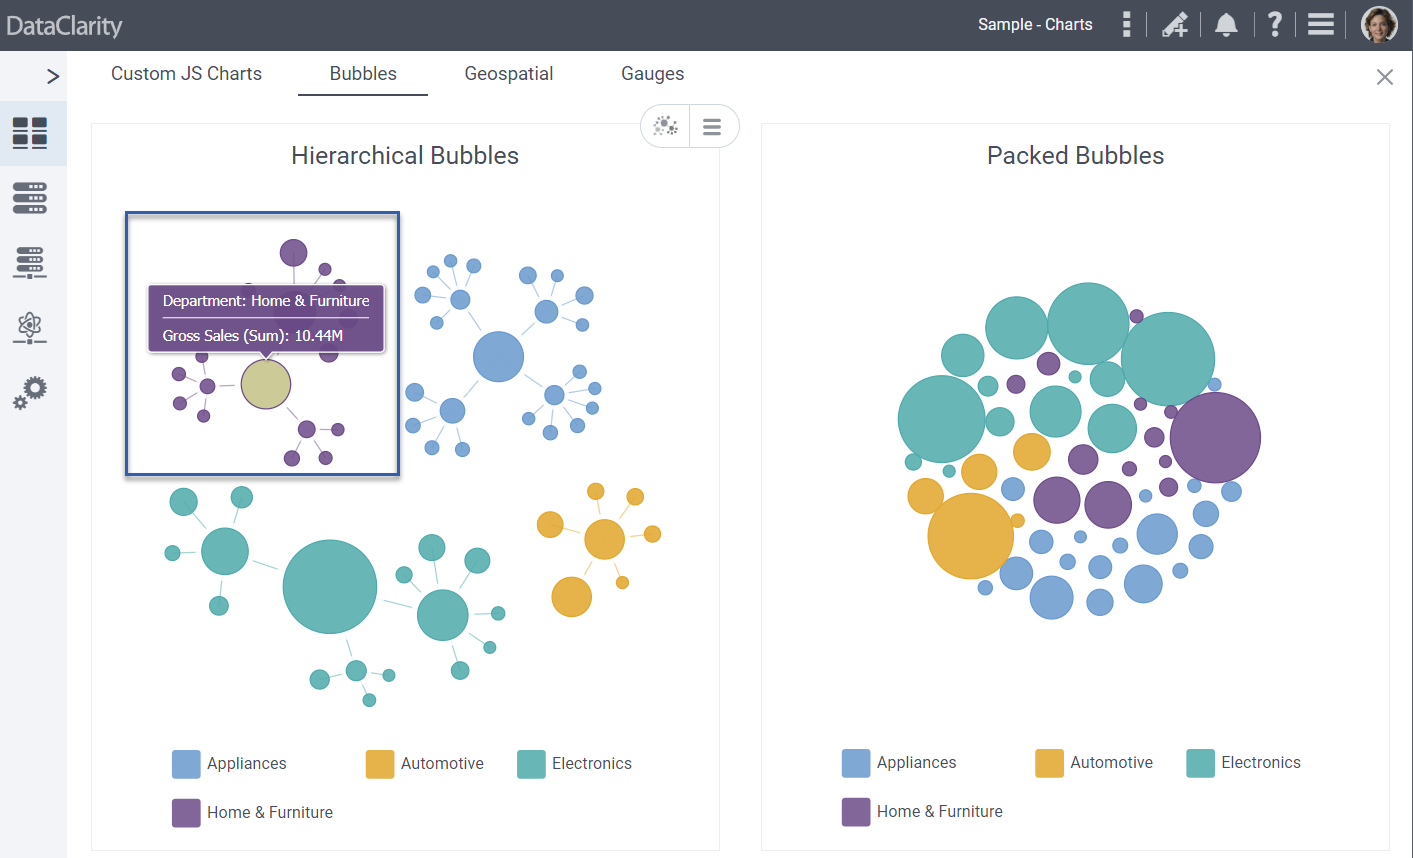
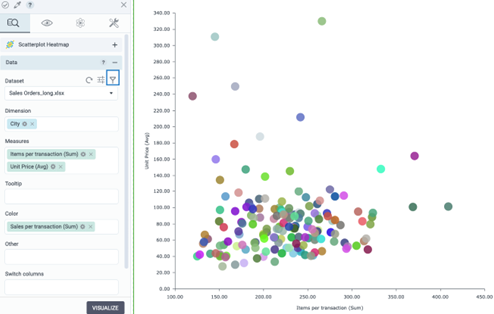
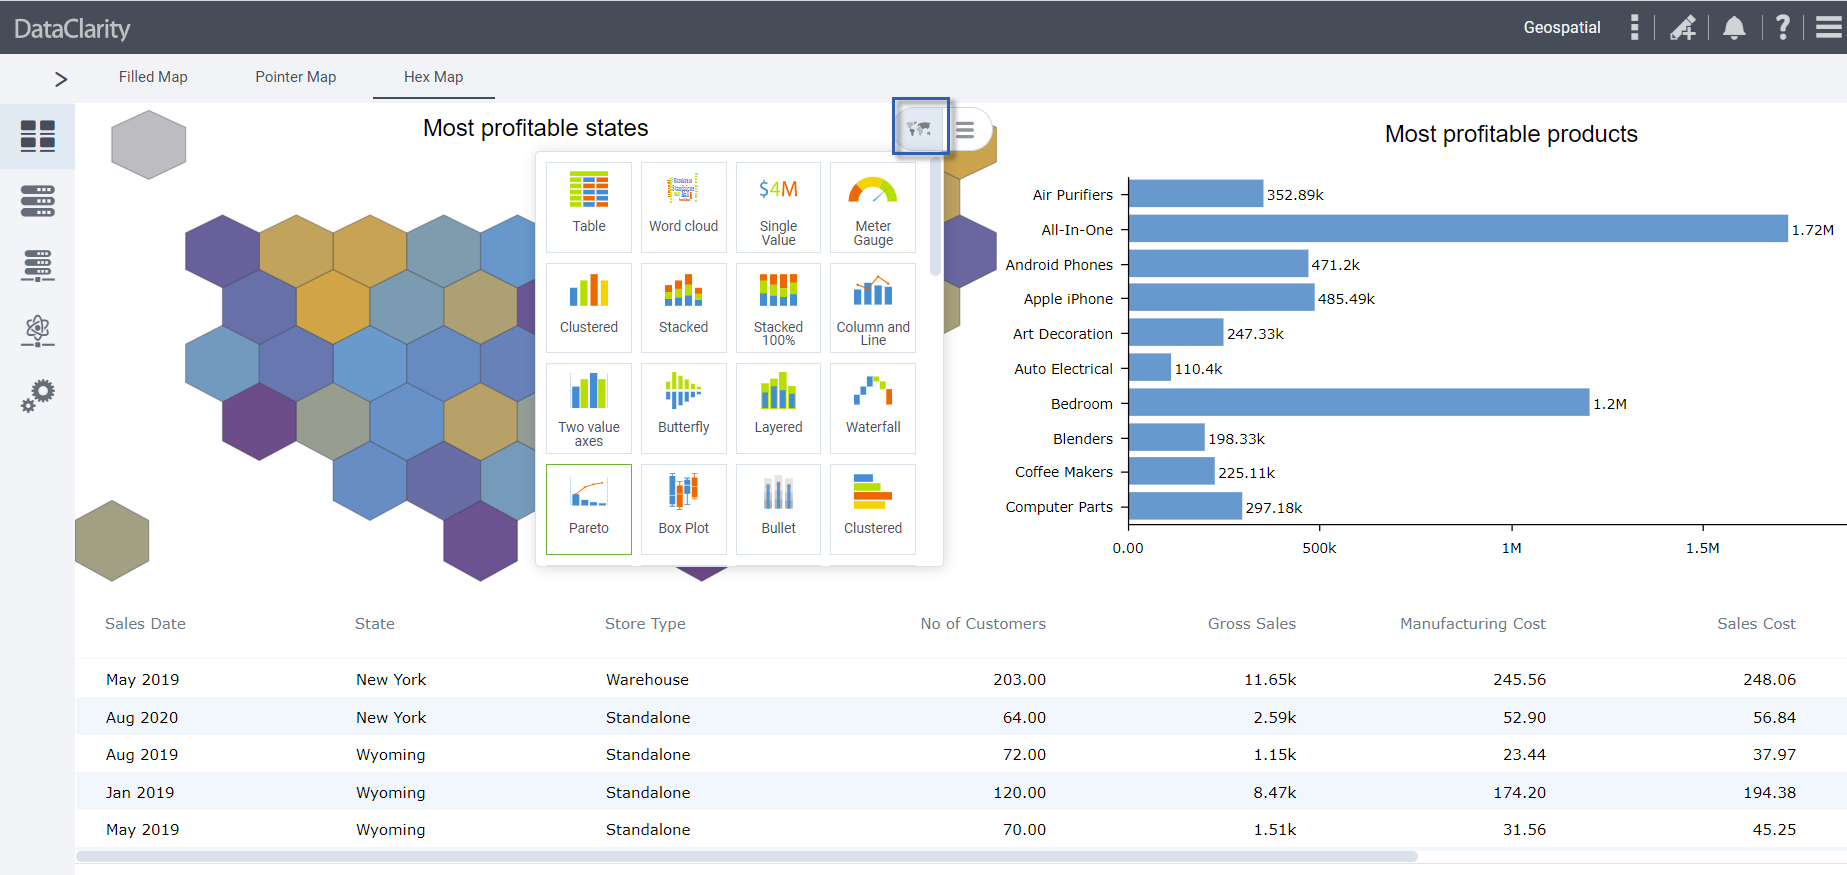
Analyze. The next step is to analyze the data using various mathematical, statistical, and machine learning functions as well as visualization capabilities that make it easy to spot the trends, anomalies, correlations within and between data sets. Visualization tools enable analysts to drill, sort, filter, and pivot data to see patterns from various perspectives and create predictive models used to score incoming data.
Report. In the final step, data analysts codify their insights in interactive reports, dashboards, or narrative “stories” designed for business consumption. If the report is deemed critical, they might pass it through a governance review process to get it “certified” so it can be distributed to business users on a regular schedule or embedded in a corporate intranet or portal.
Today, there are self-service tools, such as data catalogs, data preparation tools, and AutoML tools that analysts can use to facilitate these tasks. But, often these tools come from different vendors and are not tightly integrated. Completing the workflow with a disjointed set of tools interrupts the analyst’s natural flow of work.
Unifying Data and Workflows
Vendors have recognized the limitations of existing toolsets to support data analyst workflows. Some now ship data and analytics integration hubs that help take the pain out of delivering business insights to business users. These all-in-one platforms contain all the functionality data analysts need to discover, prepare, analyze and report on data.
Data Fabric. More importantly, data and analytics integration hubs create a “data fabric” that stitches together disparate data sources into a unified whole. A company might have 20 or 200 distributed data sources running on different systems with different databases. Still, a data and analytics integration hub makes those sources appear like they are running on a single, local data server. This capability dramatically greatly simplifies data access, making it easy for data analysts to discover, prepare, and analyze data.
Data Virtualization. The data fabric is made possible by a data virtualization engine. The engine gives data analysts real-time access to distributed data sources without them having to know the location of those sources or how to access them. The essential capabilities of data virtualization consist of data abstraction, zero data replication, real-time access, self-service data services, and security and metadata governance.
- Data abstraction. A data virtualization engine gives data analysts access to distributed data sources without them having to know the location of those sources or how to access them. It hides the data access complexity by virtualizing the disparate data resources and making them seem like they are part of a single repository.
- Zero data replication. A data virtualization engine does not move the data but leaves it as its source. It can cache only the query results that are frequently used by users. Advanced caching capabilities allow synchronizing the updates on the data sources with the cache results.
- Real-time data access. A data virtualization engine gives data analysts real-time access to any data. The engine dynamically queries the distributed sources, pushing native SQL to each source, and joining the results on the fly. It supports data transformation through calculations and data cleansing functions without the latency of a traditional data movement approach.
- Self-service data services. A data virtualization engine provides a universal semantic data layer that facilitates self-service data discovery for analysis for end-users. A standard data protocol allows data analysts to query and visualize the data in any of their preferred tools.
- Metadata and security governance. A data virtualization engine provides a single entry point for data access, security, and management. Additionally, it provides access to data and metadata catalogs to help users search and understand the data they access.
Summary
This article examines how data and analytics integration hubs provide an all-in-one, integrated environment for data analysts to discover, prepare, and analyze data. At the heart of a hub is a data virtualization engine that provides a supporting data fabric that stitches together distributed data into a logical data view accelerates the data analyst workflow.
The final article in this series will examine how these hubs integrate diverse sets of BI tools to create a universal semantic layer and report catalog.