The newest release of DataClarity is here! With DataClarity 2020.1, we’re continuing to make it easier for you to connect, prepare, and visualize your data. This release is packed with amazing features and ideas from our loyal customers. Here are a few of our favorites:
- Advanced dataset sharing permissions, including view, share, edit, and set permission are now available. These permissions are identical to the ones released for Storyboards on the 2019.9 release last month, and together provide tremendous flexibility for organizations to balance governance and self-service objectives in a powerful yet agile hierarchy of layered permission controls.
- Customize storyboard sizes to accommodate larger layouts and varying devices, sizes, resolutions, and printing requirements. Users can now select from automatic, fixed, and custom sizes which can be a hybrid of both automatic and fixed providing best-in-class flexibility.
- Support for TimeDate and Time. This feature provides users with more options and flexibility to create DateTime and Time-based visualizations and analyses, and manipulate dates and times using the built-in aggregations and functions.
- Easily embed and consume storyboards outside DataClarity through the publish storyboards to web feature.
- Widget copy and paste, more chart formatting options, and many more!
Let’s take a deeper look at our latest release.
Data Preparation
Support for DateTime and Time data types
In addition to the Date column types, users now have support for DateTime and Time columns when creating datasets. The data profiling automatically identifies the DateTime and Time column types and sets the appropriate data reporting role matching the physical data type. This feature provides users with more options and flexibility to create DateTime and Time-based visualizations and analyses, and manipulate dates and times using the built-in aggregations and functions.
When using built-in Date, DateTime or Time calculations, DataClarity’s Data Engine sends optimized native SQL calculations to all the data sources and executes in memory the calculations that are not supported by the underlying sources.
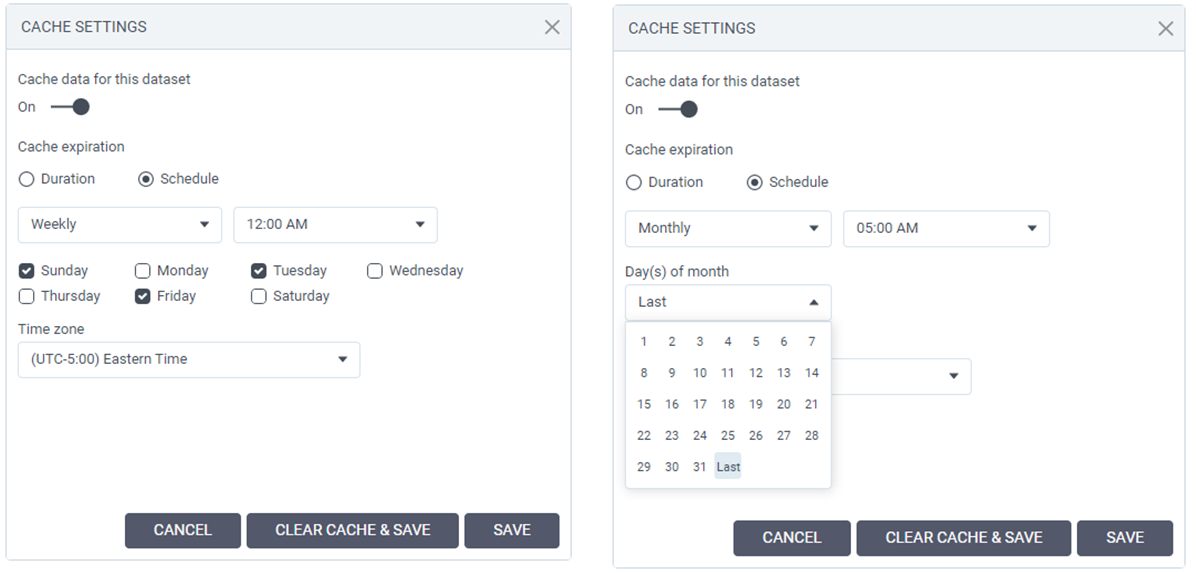
Dataset cache expiration scheduling
Users can now configure cache expiration based on both duration and schedule. They can schedule the data cache expiration based on hourly, daily, weekly, or monthly recurring periods. This feature allows data modelers to fully optimize the cache by synchronizing the cache duration with the data refresh schedule for each data source. A full synchronization of the data caching with the updates on the data sources ensures complete data integrity for all users.
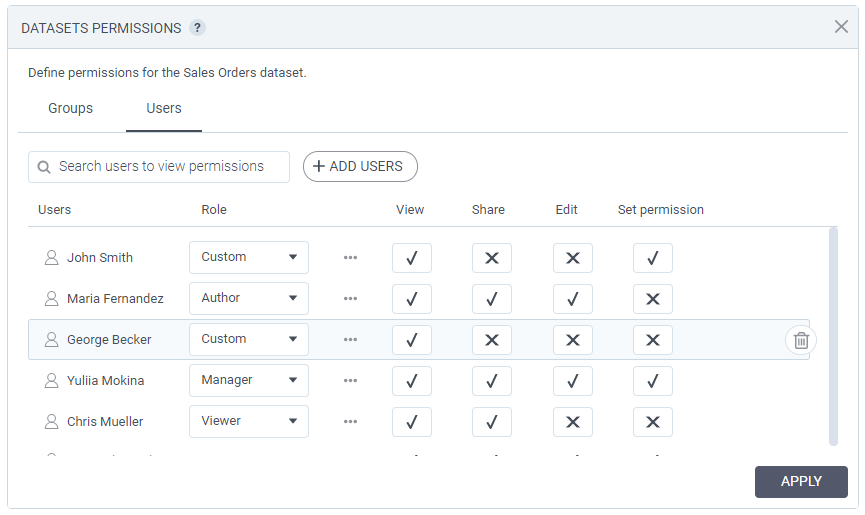
Advanced dataset sharing permissions
Previously, users could only share a dataset with no option to set specific permissions. Now, a dataset creator can set specific permissions for a dataset such as view, share, edit, and set permissions. Additionally, users can quickly share datasets with users and groups with the default data permission, and modify the permissions any time later, to accommodate different governance use cases.
These new capabilities allow organizations to enforce governance standards while allowing flexibility and ease of use for agile self-service across teams and user communities.
User-level permissions precede group permissions. For increased security purposes, when a user belongs to two or more different groups and the user’s specific permissions are not specified, the most restrictive permissions apply.
The permissions set by an administrator will precede those that are granted by a dataset manager. To be able to set permissions for a dataset, a user needs to have both the right to set permissions (set by the administrator) and the permission granted by the dataset manager.
SSL connection to Data Server
Starting with this release, users have the option to connect and consume their datasets using a secure SSL connection to DataClarity Data Server.
Data Visualisation
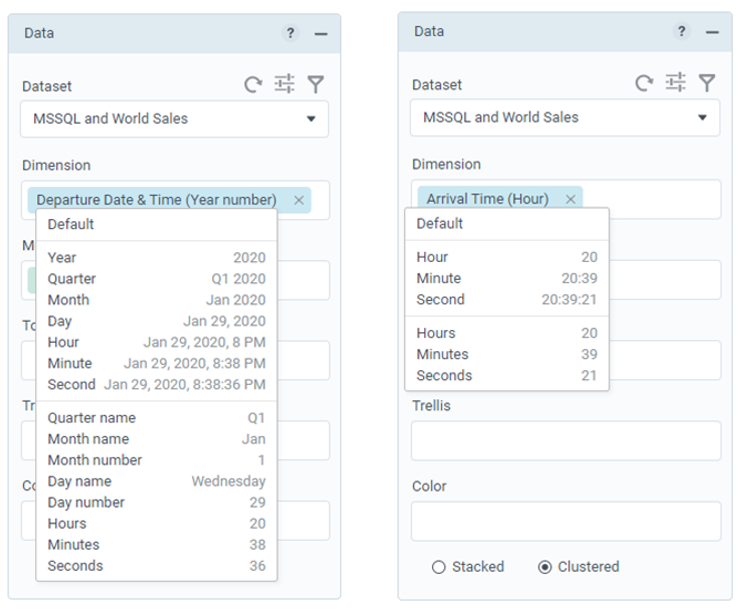
Support for DateTime and Time data analysis
In addition to the Date column types, users now have support to create visualizations and perform analyses over the DateTime and Time column types. Built-in calculations and aggregations are available for users to quickly manipulate the data to support various analysis requirements and use cases.
When using built-in Date, DateTime or Time calculations, DataClarity’s Data Engine sends optimized native SQL calculations to all the data sources and executes in memory the calculations that are not supported by the underlying sources. In addition to the Date column types, users now have support to create visualizations and perform analyses over the DateTime and Time column types. Built-in calculations and aggregations are available for users to quickly manipulate the data to support various analysis requirements and use cases.
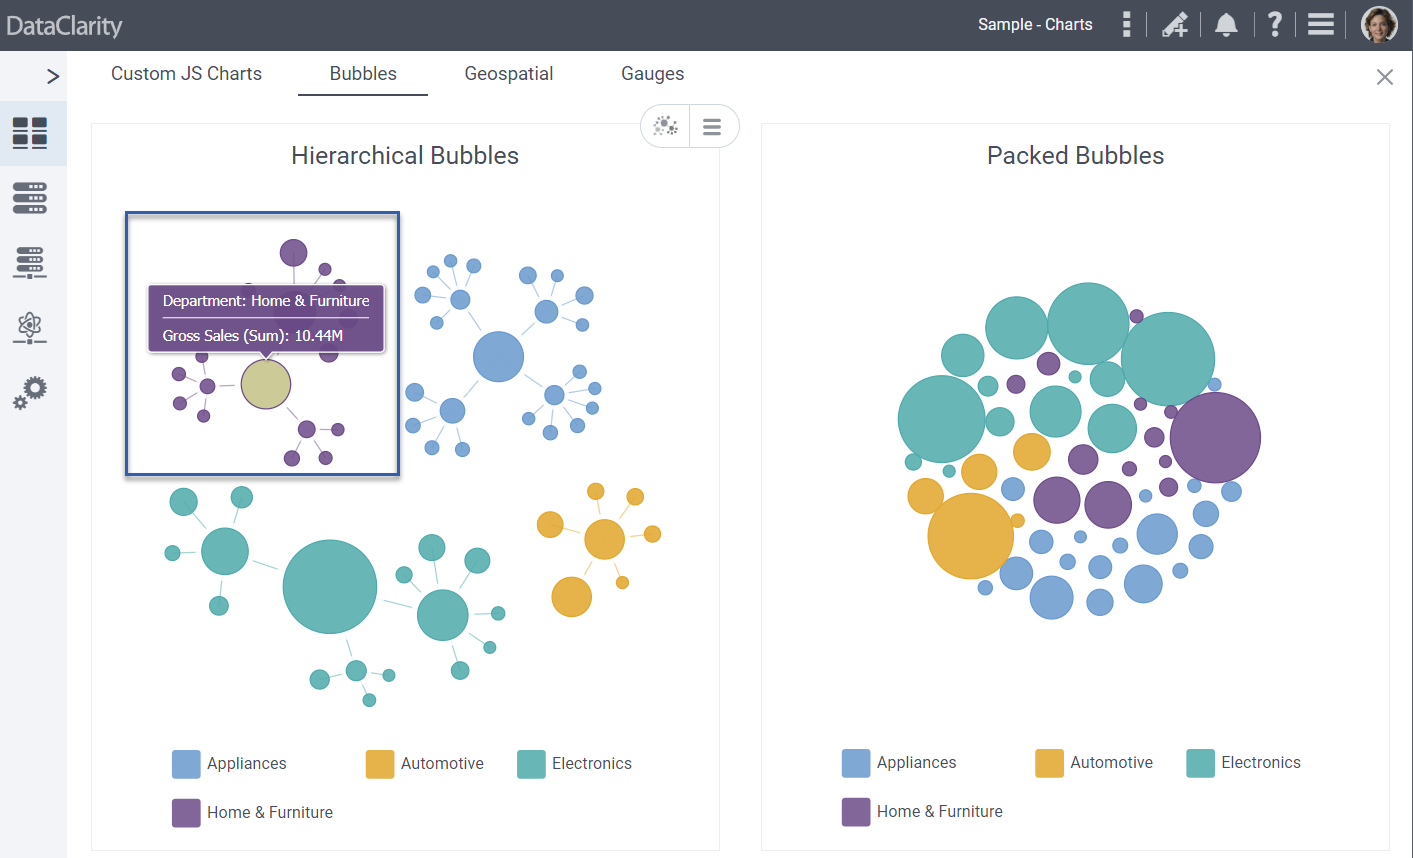
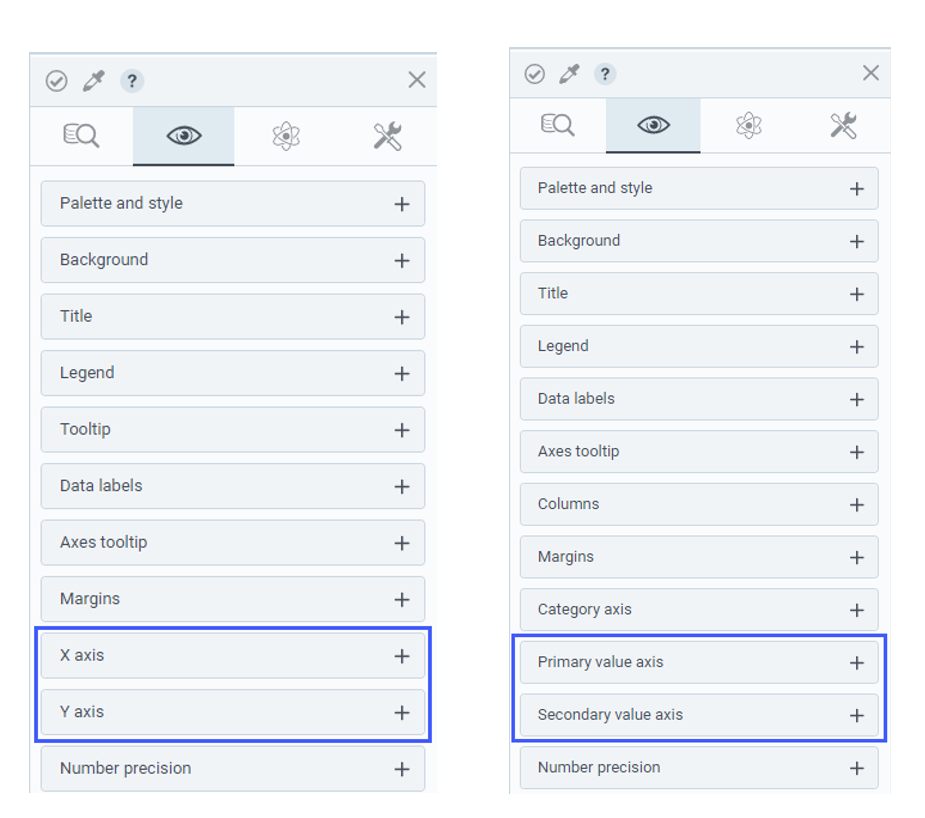
Individual customization of each axis for two-value chart types
When using charts with two value axes, users can now set up the appearance of each value axis separately.
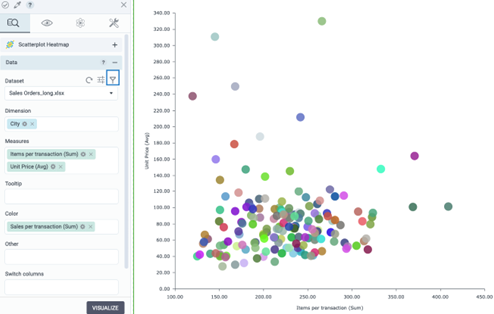
For scatterplot, bubble, and scatterplot heatmap charts, on the Appearance tab, the Value axis section has been split into two separate sections called X axis and Y axis.
For the two-value axis line and bar charts, as well as for the Pareto charts, on the Appearance tab, the Value axis section has been split into two separate sections called Primary value axis and Secondary value axis.
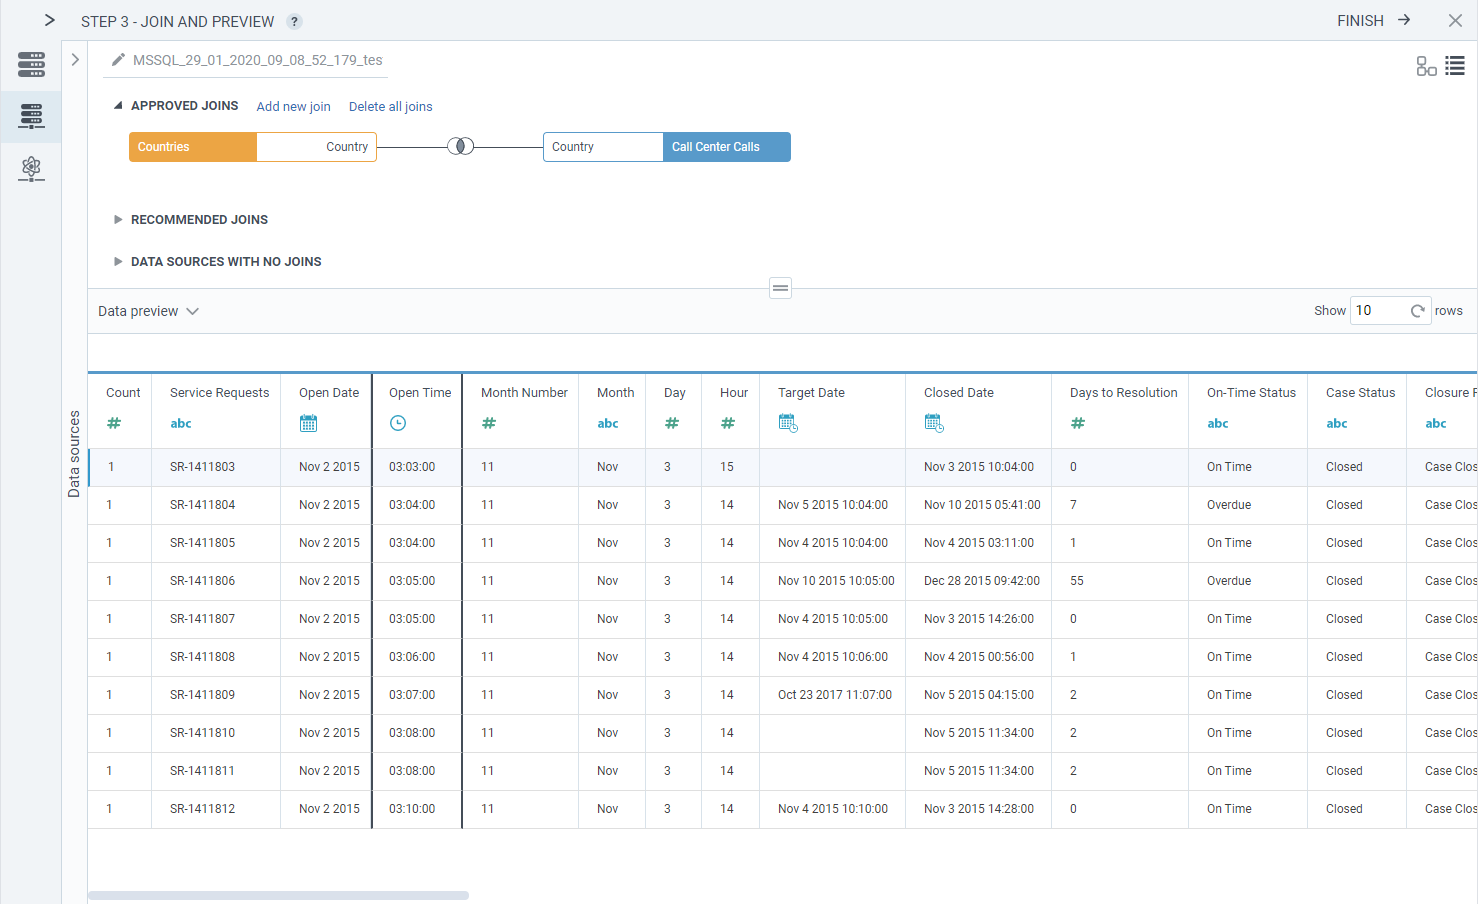
Data lineage for dataset columns
Starting with this release, users can view data lineage details about a dimension or a measure, such as the data type, reporting role, whether it is a calculation, and database locations and path.
This feature provides organizations with a means to track and validate data with a clear understanding of where the data is coming from and how it is used and transformed.
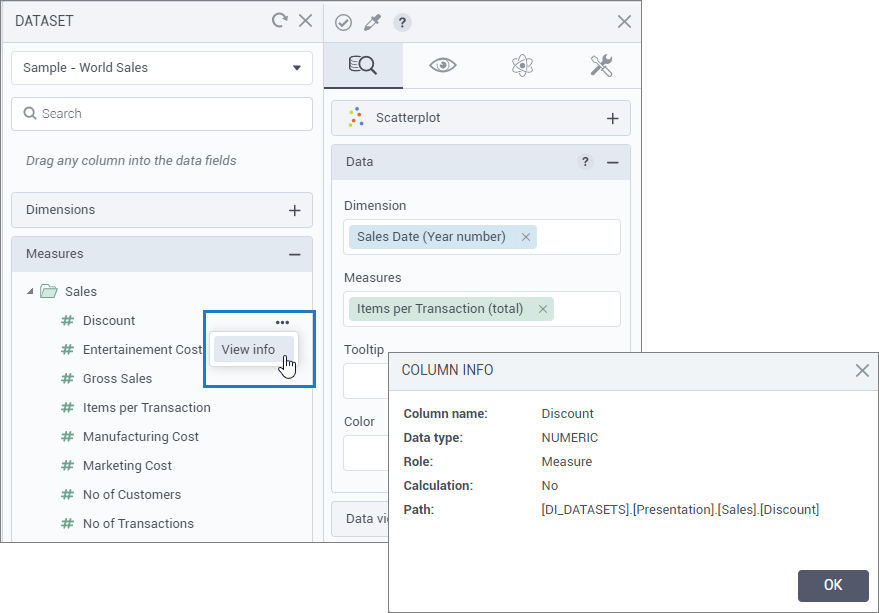
The data lineage feature is available to users when accessing the chart advanced data options pane.
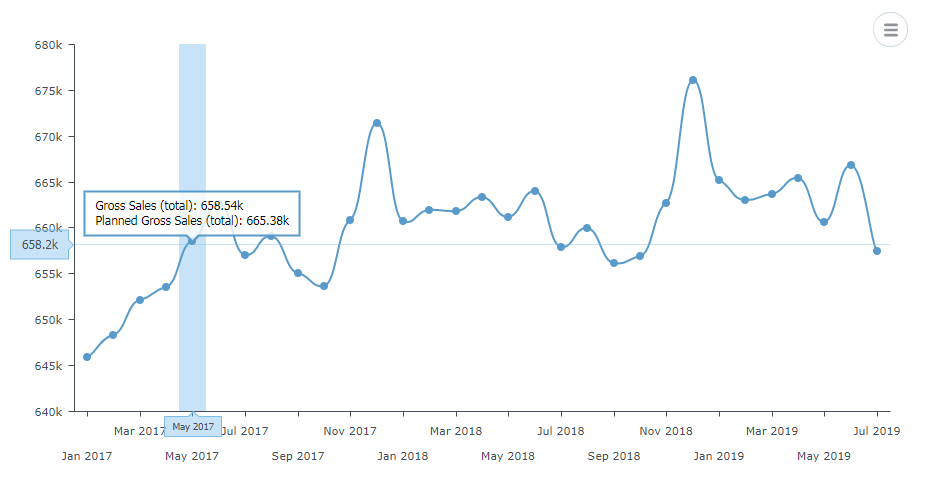
Additional chart tooltips customizations
Users are now able to customize the cursor behavior for the charts: they can display a category line shadow, change the tooltip background and font colors, activate the cursor zooming and data selection, and change the bullet size options when pointing to a specific data element on the chart.
Storyboards
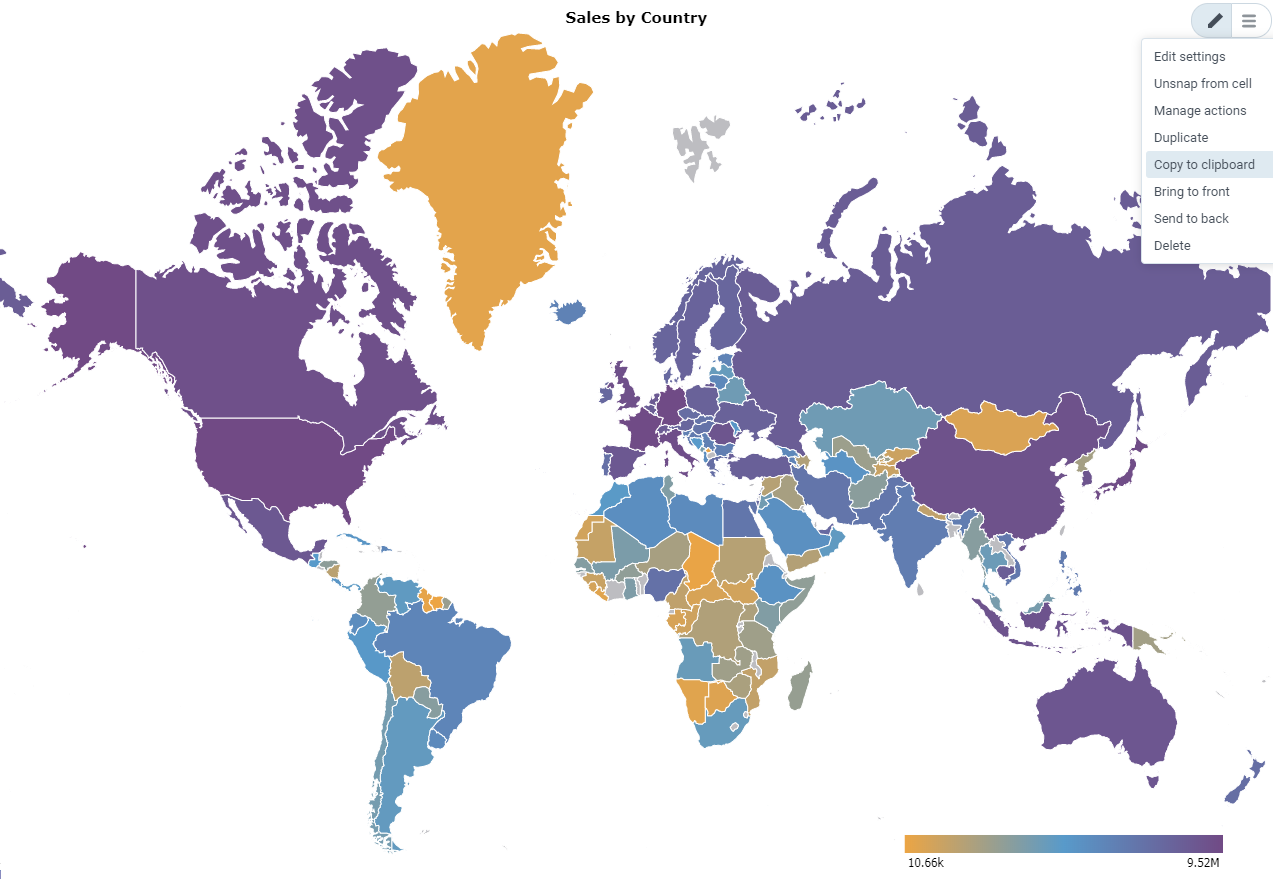
Widget copy and paste actions
Now, users can copy any widget to the clipboard, and paste it anywhere, including other pages, storyboards, or environments.
In addition, a user can send a copy of the widget in a JSON format to other users to add to their storyboards.
This feature helps users accelerate the creation and management of storyboard content and promotes sharing and collaboration across teams and user communities.
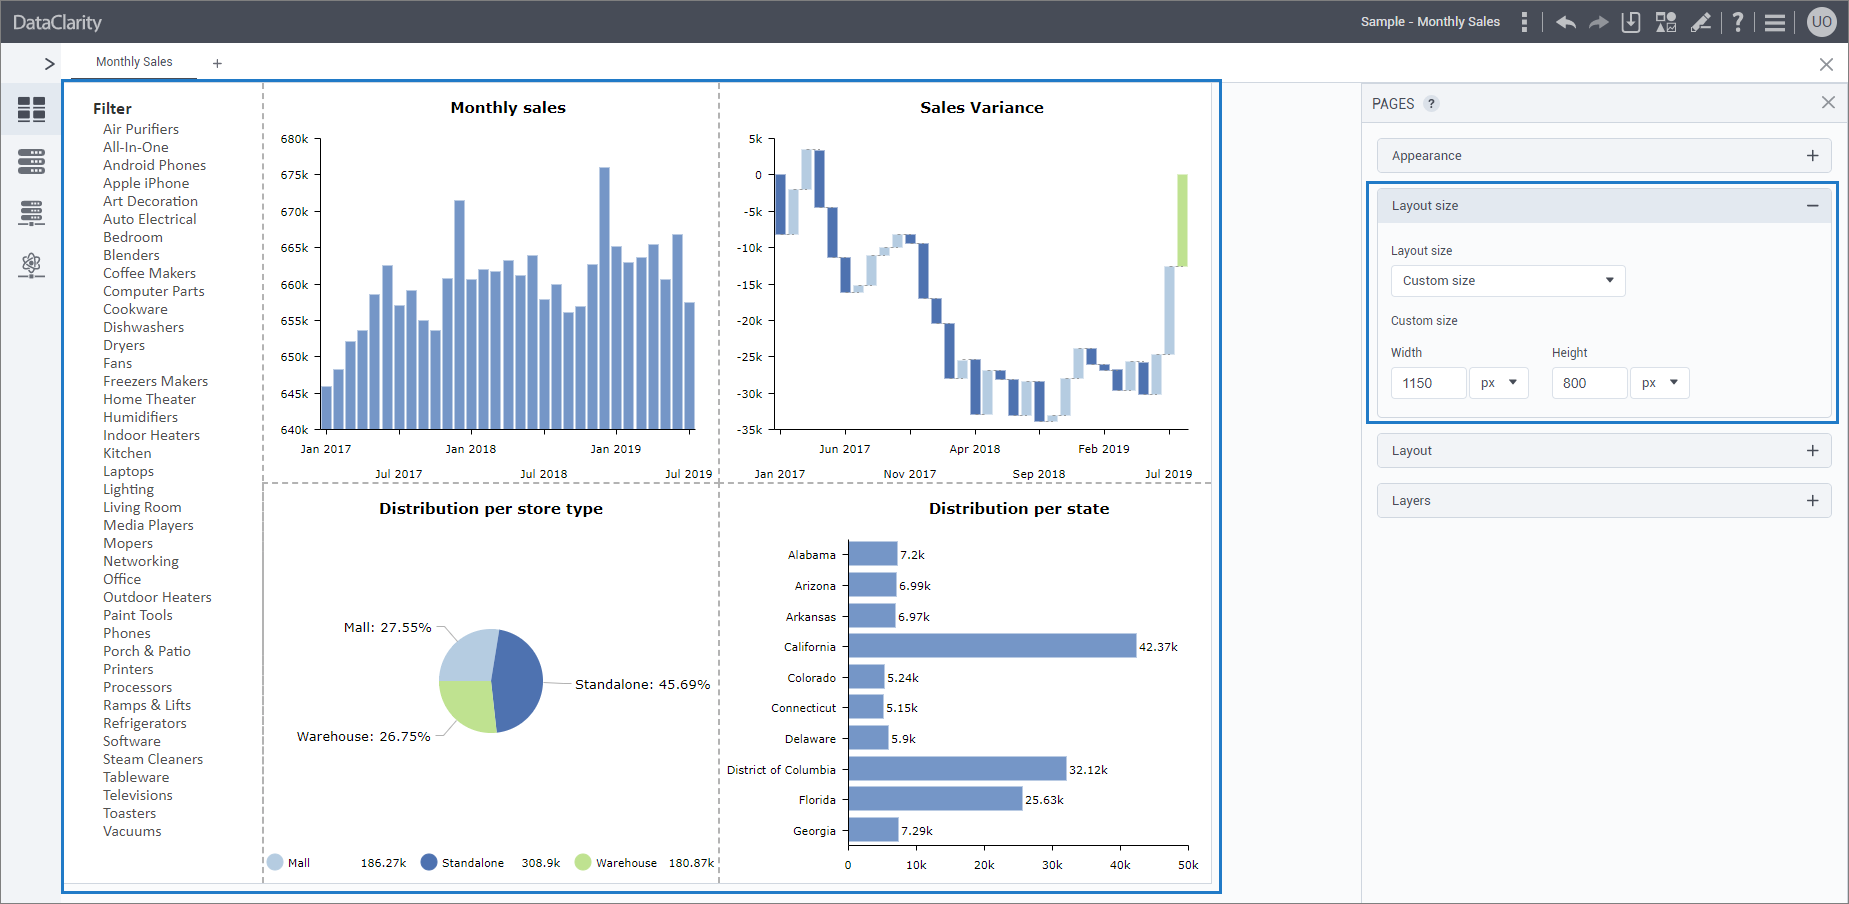
Customize storyboard layout size
Starting with this release, users can set the layout size for each storyboard page to accommodate various devices, resolutions, sizes, and printing requirements.
To support this feature, a new Layout size section has been added under the page customization pane that includes multiple options for the page layout as follows:
- Automatic – The storyboard layout area is automatically adjusted to the screen size and resolution of the browser. When using this option, widgets are automatically rendered to fit the screen without scrolling horizontally or vertically.
- Fixed size – The storyboard layout area uses one of the predefined fixed sizes. For example, desktop of a certain resolution, A3 landscape, A4 portrait, or other. When using this option, the widgets maintain their designed size and, if necessary, users can scroll vertically or horizontally to view the content.
- Custom size – The storyboard layout area uses the custom size according to the specified values for width and height (in pixels, or as percentage of the whole page area). This option allows users to fully customize the size of the page to accommodate their use cases including combining automatic with fix sizes.
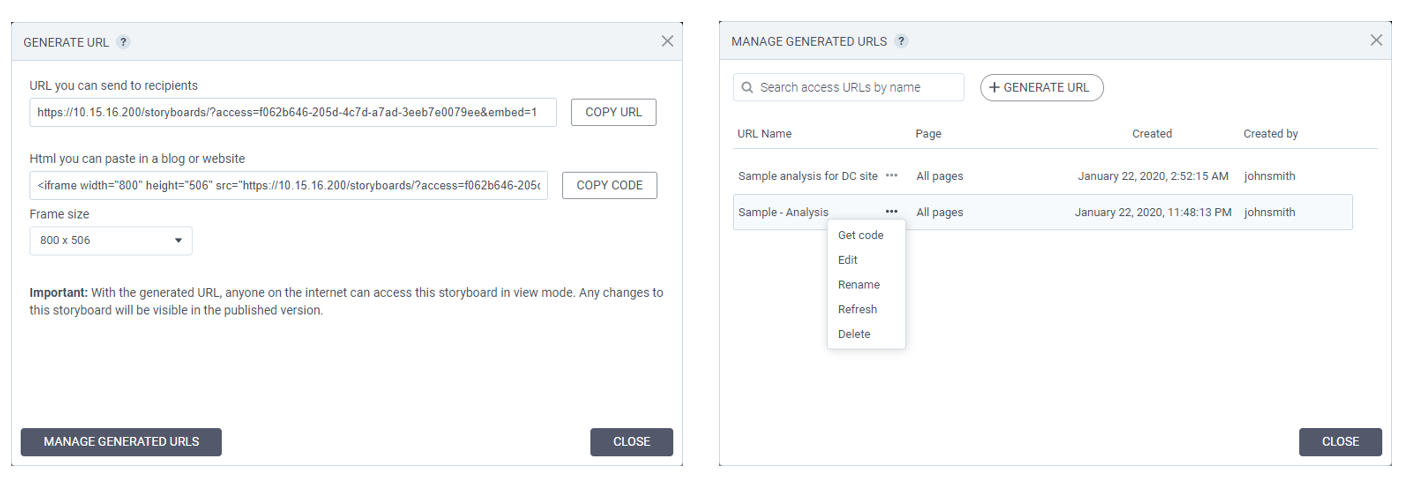
Publishing storyboards to web
Starting with this release, users can embed and consume storyboards outside the DataClarity platform, such as in websites, blog posts, or social media, without further user authentication. They can choose to publish only a specific storyboard page, or the entire storyboard. The published storyboard URLs can be edited, updated, refreshed, or deleted.
Published storyboards can be viewed by anyone on the internet in view mode. Any changes to a storyboard will be visible in the published version.
Administrators and storyboard managers can control who can publish storyboards to web. The permissions set by an administrator precede those that are granted by a storyboard manager. To be able to publish a storyboard to web, a user needs to have both the permissions (set by the administrator) and the permission granted by the storyboard manager.
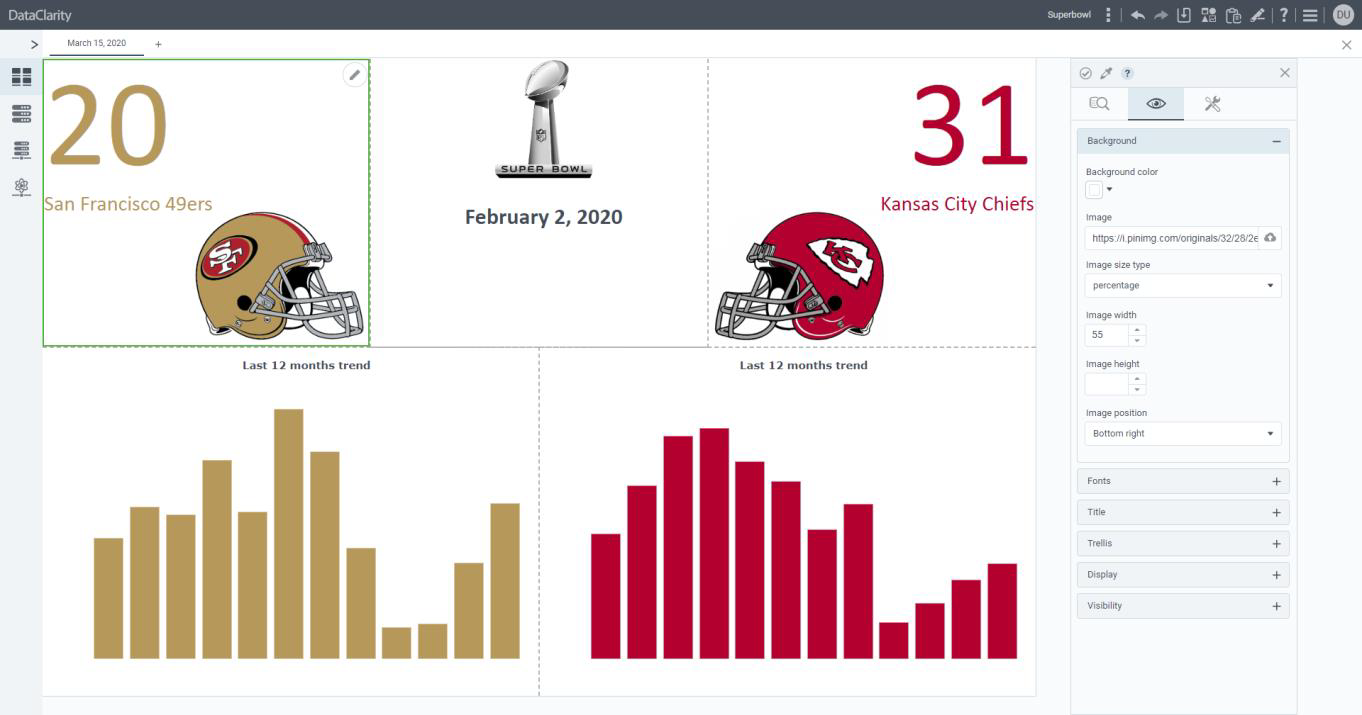
Images as backgrounds for the Text and Single Value widgets
Now, users can also set a background image for the Text and Single Value widgets. Thus, they can add custom images, or any other images related to a storyboard.
Tenant and User Management
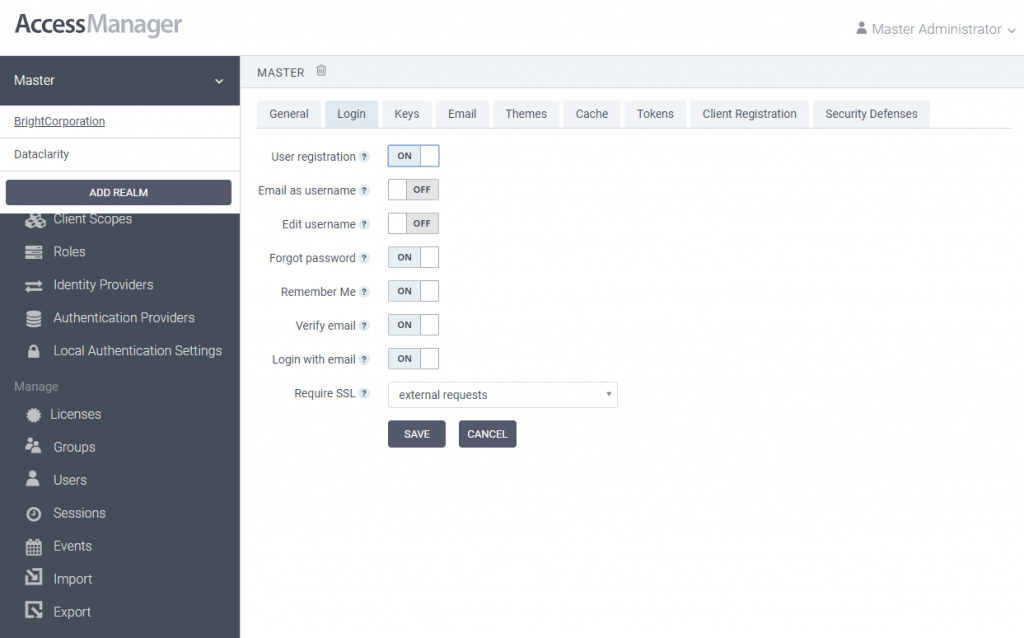
User tenant self-registration and provisioning
In addition to user self-registration, administrators can now enable users to self-register in a new tenant. This capability allows SaaS organization to fully automate user and tenant provisioning for a broad spectrum of use cases including trials, evaluations, and proof of concepts.
The tenant self-registration capabilities include the following:
- RestAPI support to request a tenant that can be used in different web forms
- Automatic tenant and user provisioning, including license activation
- Automatic email notification to system administrator(s) regarding the newly created tenant
- Automatic email notification to end-users with login information, welcome password, and on-boarding information
- Ability to customize the email templates for both end-user and administrator
Get started with DataClarity or upgrade to DataClarity 2020.1 today to take advantage of all of these new features.